


Suppose readings at a coastal monitoring point rise after rain, with humidity increasing over the same period. Two rising lines readily suggest moisture interference. A weather system might also change the air’s origin and genuinely increase pollutant concentrations. This hypothetical case asks where the observed change comes from. Until the equipment, data and environment have been examined, the curves alone cannot settle the two explanations.
Humidity effects and transported pollution may share the heading “background interference,” but they belong to different questions. Instrument response concerns the measurement method; the composition of the air calls for investigation based on retained observations. Distinguishing those layers gives corrections a defined target and reduces the risk of removing information the project meant to preserve.
Start with the purpose of the measurement
Is the site tracking environmental trends, comparing conditions before and after an intervention, or supporting a particular operational decision? Each purpose has different needs for time resolution, data quality and reference evidence. Taiwan’s Ministry of Environment distinguishes national stations and sensor deployments by uses such as regional trends, hotspot investigation and microenvironment observation. Denser coverage adds clues without making different instruments interchangeable.
For the rain example, first establish whether the readings represent a change in the target pollutant, then consider whether a source can be attributed to a particular facility. An unresolved measurement question leaves attribution without a foundation. Ordering the investigation helps staff explain the evidence they have without asking one plot to answer everything at once.
Moisture can affect both the sensor and the sample path
Sensor technologies differ in their responses to temperature, humidity and other substances. EPA materials explain that environmental conditions can affect bias and sensitivity in some sensors, and that performance can change over time. High humidity therefore does not universally mean a positive bias. The direction and magnitude depend on the target gas, instrument design and conditions under which performance has been checked.
With pumped sampling, follow the path from the inlet to the instrument. Warm, moist sample gas entering a cooler line may condense, affecting subsequent sampling and measurement. Vaisala’s manual for a particular carbon dioxide instrument explicitly addresses condensation in the measurement chamber. Such documentation identifies questions worth investigating, but its prescribed arrangements apply to the specified equipment and conditions.
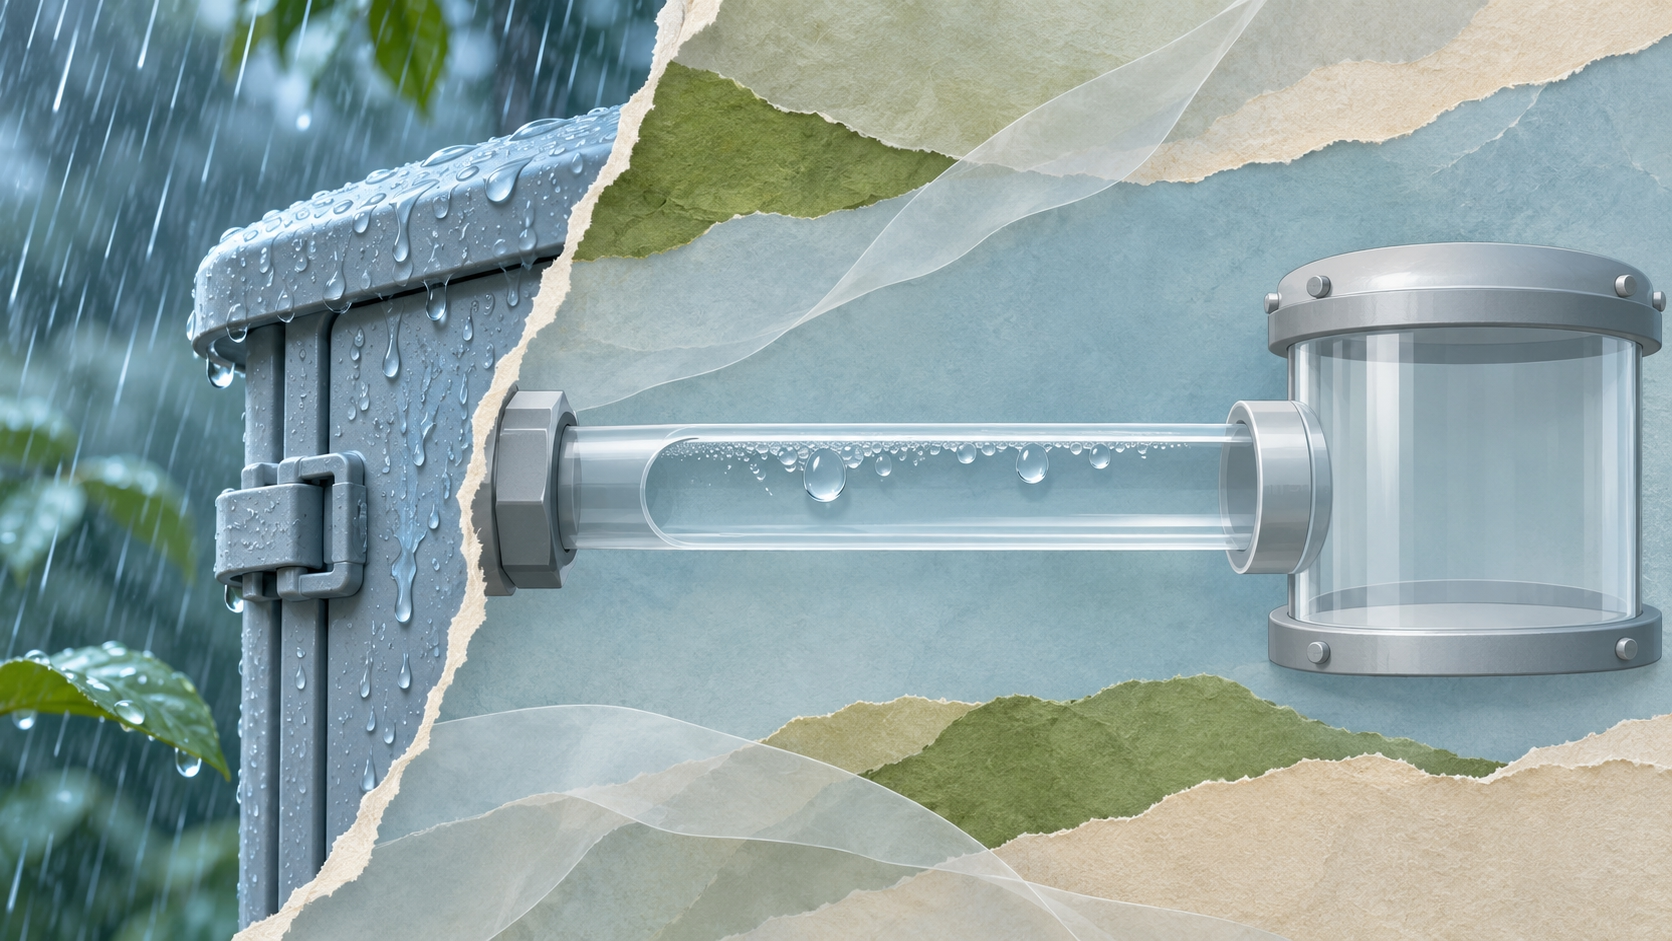
Heating or drying is not automatically a complete answer. Sample conditioning can itself change what reaches the sensor, particularly for substances affected by water or sampling materials. Discussing the sampling method, tubing materials, expected conditions and maintenance during equipment selection makes responsibilities clearer than searching for a universal compensation formula after installation.
Repairing the sampling system and correcting data deserve separate treatment. A blocked inlet, abnormal flow or water in a line calls for equipment investigation. A confirmed repeatable bias may then justify evaluating a validated correction. A smoother plot does not establish that measurement conditions have been restored. Retaining original records and the processing history keeps the distinction visible.
Give the unusual period enough context
For the hypothetical case, retain raw readings, timestamps and instrument status, and examine the period before, during and after rain on one timeline. Do not isolate only the highest points or delete them first. Align cleaning, calibration, connection-loss and restart records with that timeline to see whether an equipment event coincides with the change. This organizes the investigation; it does not yet establish a cause.
If the unusual readings overlap maintenance, check how those observations should be marked and whether restoration checks were recorded. The absence of a logged event does not clear the instrument; the inlet, sample path and other status information may still need inspection. Conversely, maintenance and a concentration increase can coincide by chance. A causal explanation needs evidence linking them.
Reference measurements provide another perspective, but timestamps, units and averaging periods must be aligned first. A short-interval reading may show a peak that a longer average does not. Locations, sampling heights, nearby roads and emission sources also need context. Putting two lines on a chart is easy; establishing that they measure comparable conditions is the more demanding work.
Comparison can point the next inquiry in different directions. Divergence by one device under certain humidity conditions supports checking its response more closely. Similar changes across comparable stations warrant examining environmental factors. Neither pattern settles the case alone, since similar instruments can share an influence. Distinguishing confirmed findings, plausible explanations and unknowns shows readers how far the conclusion has progressed.
A northeasterly wind does not guarantee cleaner air
Taiwan’s monsoon patterns and terrain make geographic context essential. The Ministry of Environment explains that northeasterly winds can improve dispersion in some areas while also transporting pollution from upstream. The effect depends on upstream concentrations, wind conditions and rainfall. Stronger winds therefore do not establish that pollution must decrease at every station.
To investigate such a change, read station timelines alongside wind direction, wind speed and the weather system. Where did the change appear first, how did it progress, and could local emissions or terrain explain differences? The aim is a set of supporting clues, not a weather map selected to fit an expectation. Stations that do not fit the hypothesis may be especially useful in revealing its limitations.
NOAA’s HYSPLIT can calculate air-parcel trajectories to help examine possible transport paths. Results depend on meteorological inputs and choices such as starting location and height; fine terrain features and rapidly changing winds may not be fully represented. A path crossing a region is a reason to investigate, not proof of a particular source or its contribution to the observed concentration.

Real background concentrations are not instrument errors
A common next question is whether subtracting a background station reveals the local contribution. That assumes the sites share the same background, the observations are comparable and the difference represents the source of interest. Differences in terrain, winds, measurement conditions or other emissions can mix several effects into that value. Background subtraction requires its own method and validation; a spreadsheet subtraction is not a completed attribution study.
Even when a study estimates the increment from a particular source, the original total concentration should be retained. Pollution remains present at the site regardless of its geographic origin. The original observations also allow researchers to compare assumptions and recalculate results. Analysis should add fields, flags and explanations rather than overwrite the observations with a single processed answer.
Use the investigation to improve the next monitoring period
Unanswered questions from this investigation can guide the next monitoring period. Missing temperature or humidity records call for better records, sampling-path problems for design and maintenance work, and interpretation gaps for purposeful reference comparisons. Each improvement should address a defined gap so that additional data are more likely to distinguish explanations previously mixed together.
Keep a record of the installation conditions: location, the inlet surroundings, sampling arrangement, equipment version and checks. Update that context when vegetation, buildings, roads or processes change. EPA quality-assurance guidance brings maintenance, data review and periodic comparisons together because measurement quality needs continued attention after initial installation.
Return to the curve that rose after rain. A single cause may remain unresolved, but the account should show which data are credible, which possibilities have been examined and what evidence is still missing. Readers can see both what the curve supports and where the judgment must pause. Giving moisture, instrument behavior and air-mass origin their proper place turns the numbers into a record that others can continue to examine.
References: Taiwan MOENV: Northeasterly Winds and Air Quality; Taiwan MOENV: Differences Between National Stations and Sensor Deployments; US EPA: Quality Assurance for Air Sensors; US EPA: Enhanced Air Sensor Guidebook (2022); Vaisala: GMP343 User Guide, Sampling and Condensation (Model-Specific Conditions); Kane: Sample Preparation and Losses of Water-Soluble Gases (Flue-Gas Applications); NOAA: HYSPLIT Model Overview; NOAA: HYSPLIT Limitations and Product Interpretation.
MTI巨晶彙審