
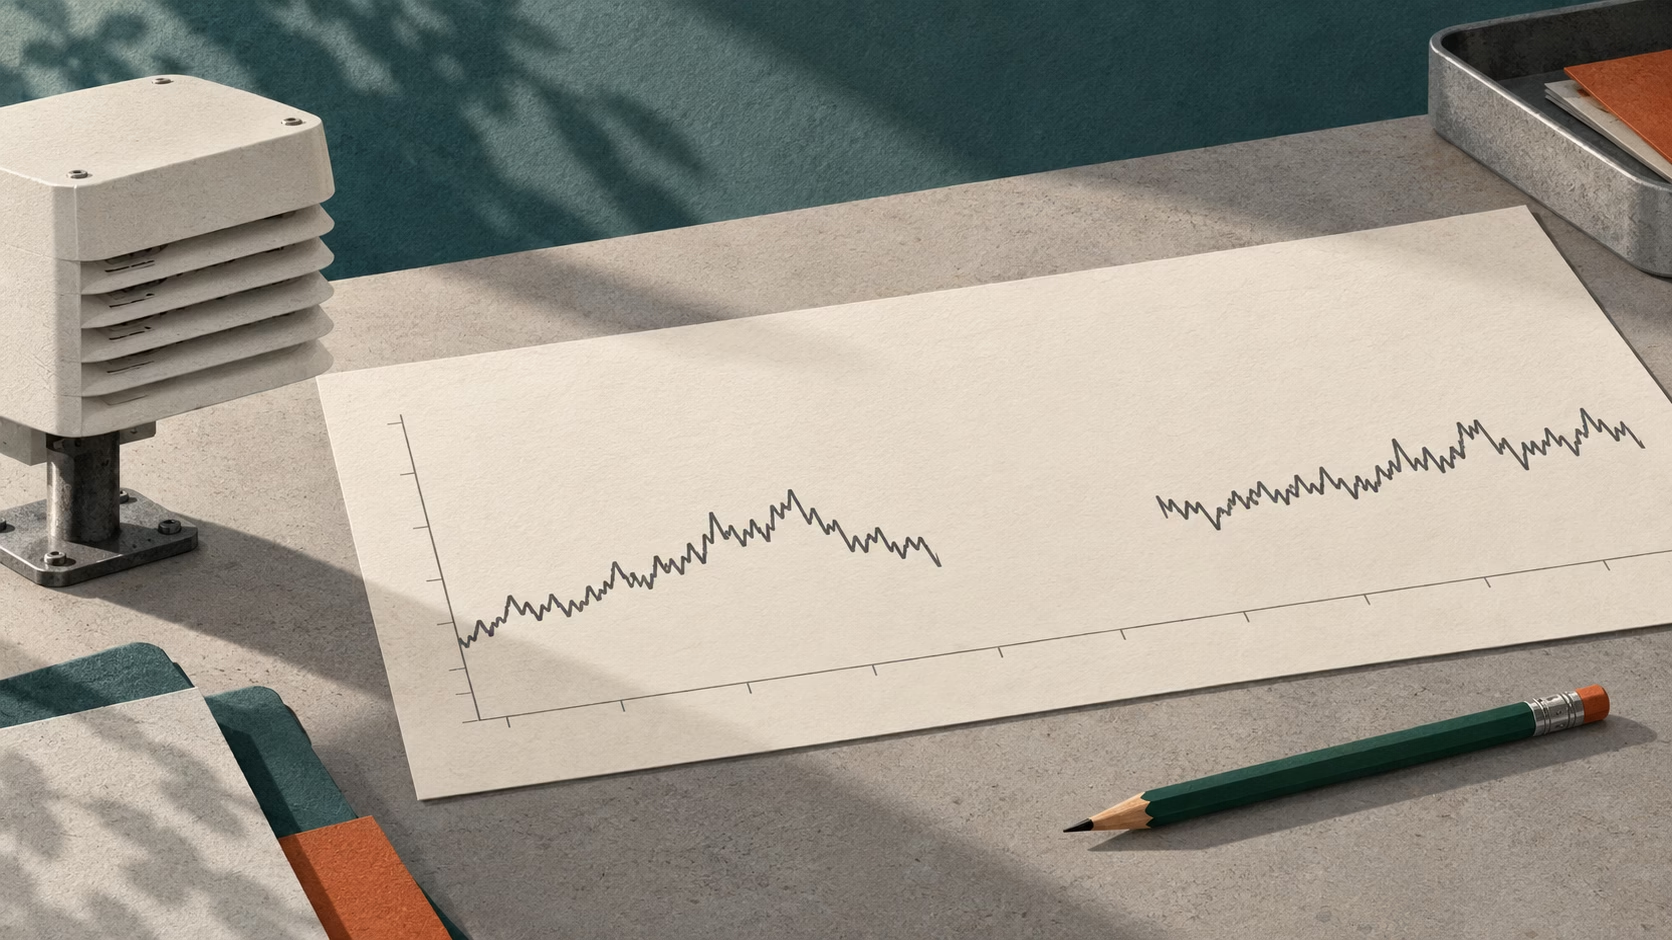

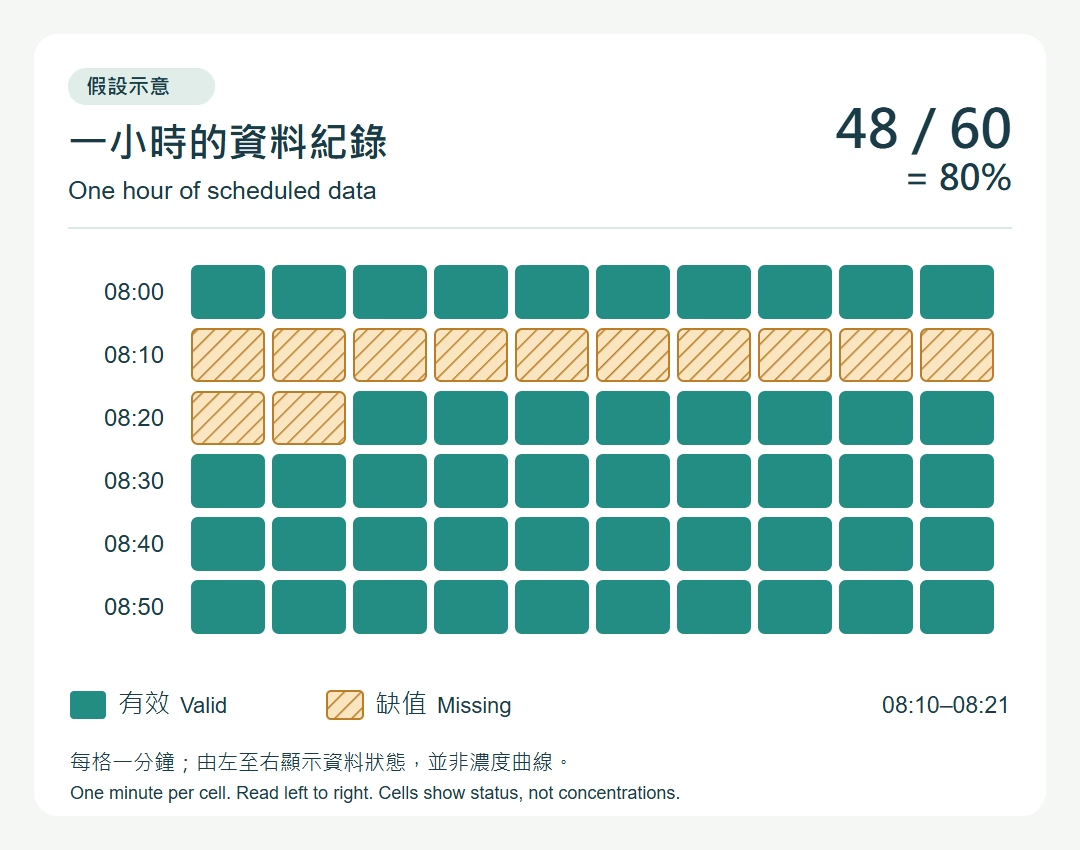
At 8:10, the curve suddenly breaks off. Twelve minutes later, the line reappears and continues to the right. The gap on the chart is brief, but it leaves a question: what were the concentrations during that time? Consider a hypothetical scenario: an air monitoring site is scheduled to generate one record per minute. The twelve records from 8:10 to 8:21 a.m. are missing, while valid records are available for the rest of the period.
The blank means there are no usable observations. It does not mean the concentration was zero, nor does it prove there was no pollution. Concentrations may have remained steady or may have changed; this chart alone cannot tell us. Even if the lines on either side of the gap are close, there is insufficient evidence to describe the unseen twelve minutes as equally steady.
Suppose 60 records were expected between 8:00 and 8:59, and the remaining 48 were deemed valid under the project’s rules. Data completeness for that hour would be 48 divided by 60, or 80%. This proportion shows how much of the expected data is valid. It cannot replace verification of instrument accuracy or, on its own, establish that the data is suitable for a particular use. Here, 80% is only an example calculation, not a universal acceptance threshold.
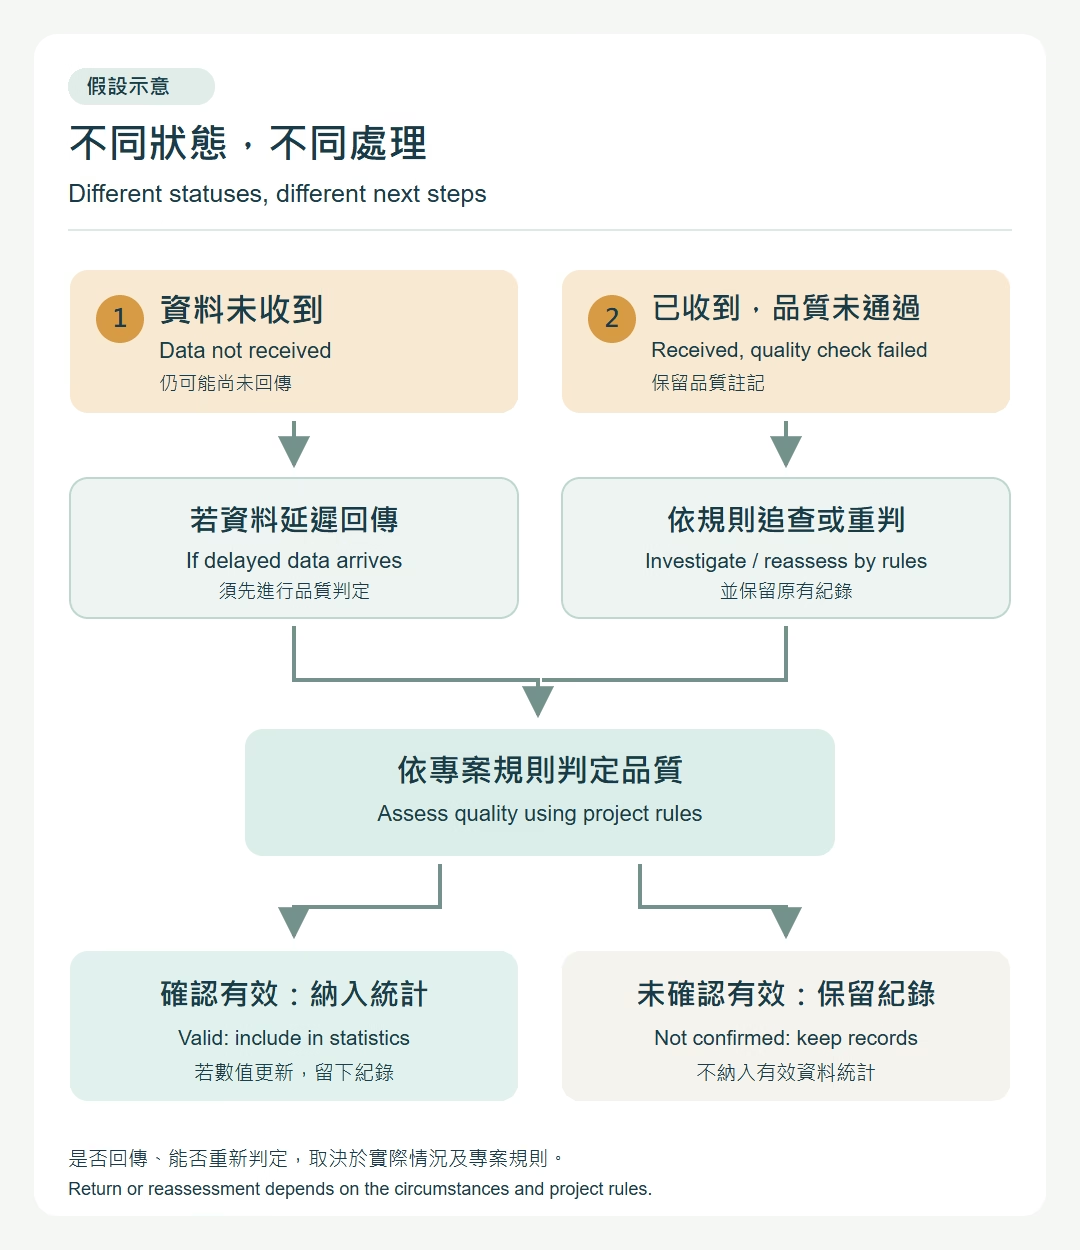
There may be more than one explanation for the gap. A power outage, a communication interruption, or maintenance could temporarily prevent data from being available. Data may also have been received but failed quality checks. Historical data for general monitoring stations published by Taiwan’s Ministry of Environment uses blanks for missing values and symbols to flag data invalidated by different checks. The same blank appearance does not necessarily represent the same data status.
To investigate these twelve minutes, start by aligning monitoring times, equipment logs, transmission logs, and quality annotations on a single timeline. In this hypothetical scenario, the investigation can begin with the records already available; different equipment may leave different clues. For each clue, record what it can confirm and what remains unresolved. If the cause has not been confirmed, keep it marked as pending investigation.
First, examine power supply and equipment operating logs. Was there a power outage, a restart, or a transition into maintenance during that period? Matching times may help narrow the search, but a restart near the gap does not establish that it caused all twelve missing records. Once equipment resumes operation, it is still necessary to confirm that measurement and recording have returned to normal.
Next, examine communications and the receiving system. If records remain on the device but have not reached the platform, investigate the possibility of transmission failure or delayed delivery. Distinguish measurement time from receipt time when checking the records: data received in the afternoon may correspond to an observation made in the morning. Treating receipt time as measurement time may leave the original gap incorrectly filled.
Then return to the raw files to check whether data actually exists for the period in question, whether time stamps are consistent, and whether there are duplicate records. Retain both the original files and the import logs so there is evidence for tracing where in the process data went missing. Data absent from the display may reflect a problem with transmission, import, or presentation. Until these have been checked, it should not automatically be described as a failure of the instrument to take a measurement.
If the raw data has been received, check quality assurance, calibration, and maintenance records to establish which data was deemed invalid and why. The presence of a value does not mean it is ready for use. Nor does the exclusion of one record mean that the same reason applies to the entire period. The monitoring manual from Japan’s Ministry of the Environment calls for recording the reasons for missing measurements, helping make equipment maintenance and data verification traceable.
It is therefore useful to retain separate statuses for “not received” and “received but invalid.” Data in the first category may still arrive later; data in the second requires examination of the basis for the quality decision. If every status is stored as a single blank, anyone taking over later will struggle to tell whether to investigate transmission or measurement quality, and will have no way to know why data was originally excluded.
Twelve consecutive missing minutes and twelve missing records scattered across an hour yield the same completeness rate, but leave different gaps in what can be observed. The first leaves an entire interval unobserved; the second leaves gaps at different times. If the work concerns changes during a specific period, whether the gaps overlap that period says more about the limitations than a single percentage does.
Reports therefore need to specify the data period, scheduled interval, expected record count, valid record count, and method for determining validity, so readers can understand where the denominator comes from. If a project has separate calculation rules for downtime or maintenance periods, explain how they apply. The denominator should not be changed after the fact simply to improve the percentage. Marking the locations of missing data then gives the completeness rate a context that can be checked.
On the chart, break the curve at missing values and label the missing period. If analysis requires imputation, preserve the original missing values, clearly distinguish estimated values from measured ones, and explain the method and its limitations. A line drawn across the gap may support analysis, but it does not become evidence of measurements actually taken at the time. It should not lead readers to believe that observations exist for those twelve minutes.
When late data arrives and is added later, first check its measurement times, source, and any duplication, then assess its validity under the project’s quality rules. Receiving twelve records does not necessarily increase the valid count by twelve. Only data confirmed to meet the rules can be included in statistics for the intended use. If the status of data previously deemed invalid is changed, the reason and supporting evidence should also be recorded.
Whenever the set of valid data changes, recalculate completeness for the affected periods, along with statistics and charts that use this data, and check whether the related reports need updating. If only the data table is supplemented while the summary retains the old results, readers are presented with two versions. Until this is resolved, the reported maximum is only the highest value in the currently available valid data; whether a higher concentration occurred within the gap remains unknown.
When making updates, records can include the data version, processing date, period changed, quality status, and items recalculated. Retain the previous results and the reasons for correction as well. Which fields are needed depends on the data workflow and delivery requirements; the aim is to let later readers find the basis for the changes. When handing the work to someone else, identify the version that includes the recovered data so subsequent citations have a clear reference.
The Ministry of Environment’s monitoring network quality assurance standards describe completeness as the proportion of valid data to the data that should have been collected. The U.S. Environmental Protection Agency’s sensor guidance emphasizes planning quality around the monitoring purpose. Official monitoring stations and general sensors differ in their uses and quality assurance practices. Safety alerts and regulatory monitoring must still be handled in accordance with applicable standards and professional judgment. What we can say about those twelve minutes on the chart still depends on the records. State what is confirmed clearly, and make the unresolved questions visible to readers.
References
- Taiwan Ministry of Environment: Air Quality Monitoring Network Historical Data and Annotations
- Taiwan Ministry of Environment: Air Quality Monitoring Network Quality Assurance Operating Standards
- Taiwan Ministry of Environment: National Monitoring Stations, Smart Urban and Rural Sensing Sites, and School and Private Sensors
- Japan Ministry of the Environment: Manual for Continuous Monitoring of Ambient Air, Sixth Edition, Chapter 4 (p. 244)
- U.S. Environmental Protection Agency: Quality Assurance for Air Sensors
- U.S. Environmental Protection Agency: Resources and Tips for Analyzing Air Sensor Data
MTI 巨晶彙審