
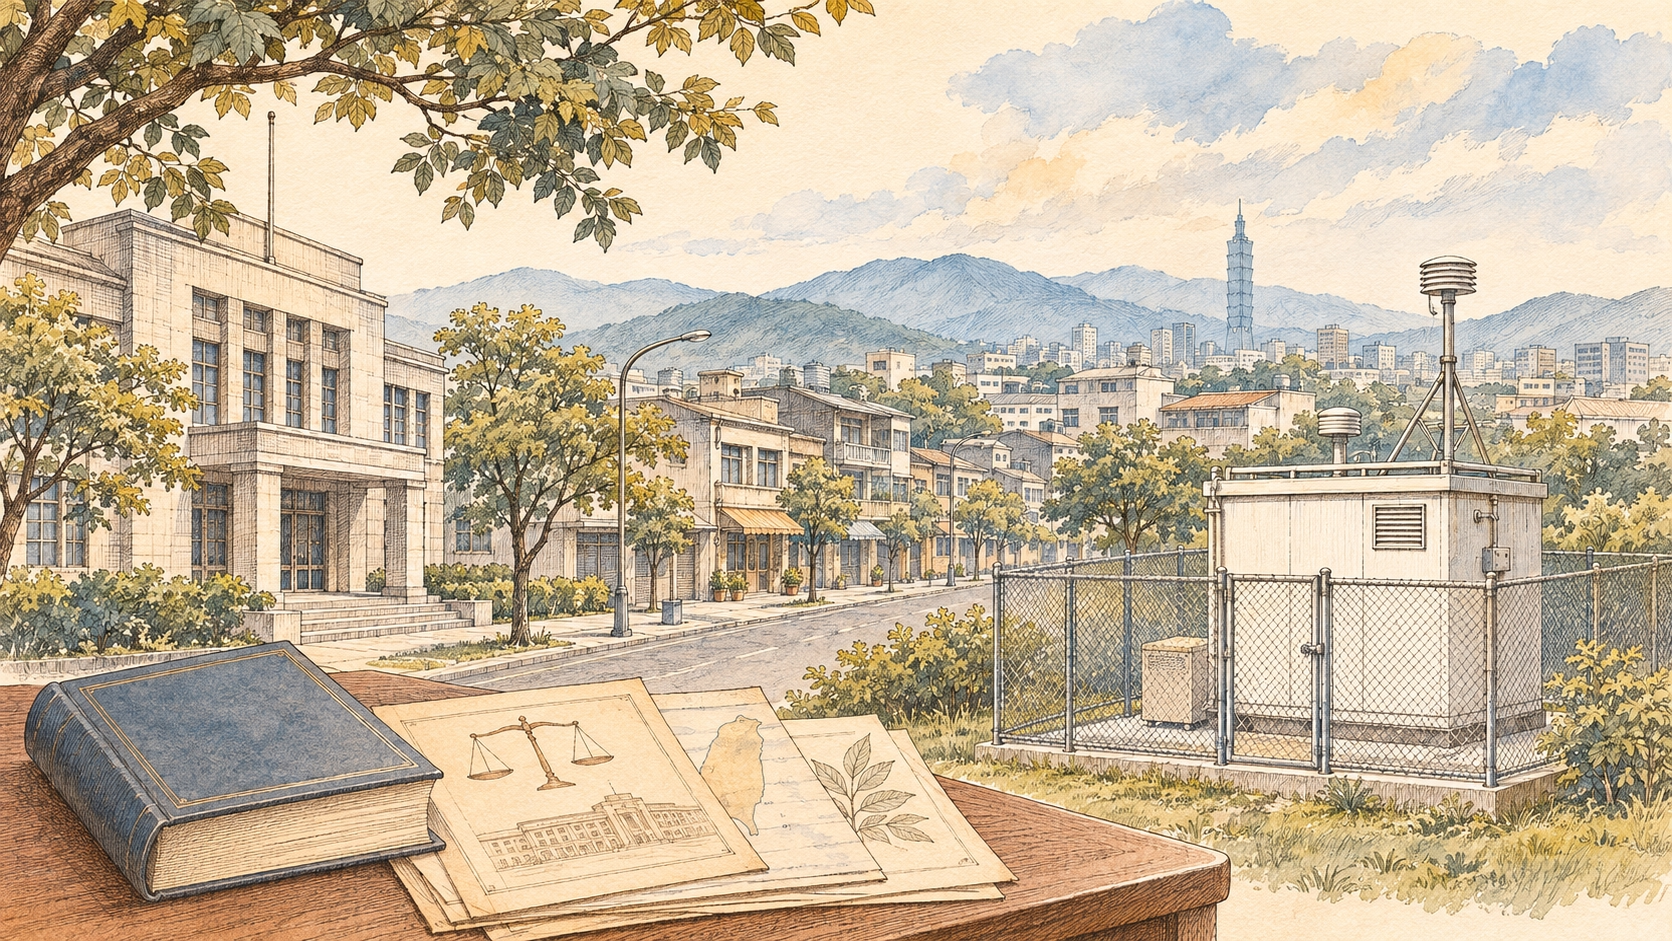

A phone, an annual report and a factory operating record may all concern the same sky. The phone presents today’s air-quality index, the report summarises a year of concentrations, and the factory records its emissions and operations. Each answers a different question. Without their purposes, time scales and applicable criteria, a larger collection of numbers may still fail to support a meaningful comparison.
Taiwan’s air-quality management can be understood through the tools developed over time: ways to observe pollution, require emitters to improve, examine policy results and give residents access to relevant information. As laws and monitoring networks took shape, they also created records against which these questions could be pursued.
Legislation assigns responsibility; monitoring records change
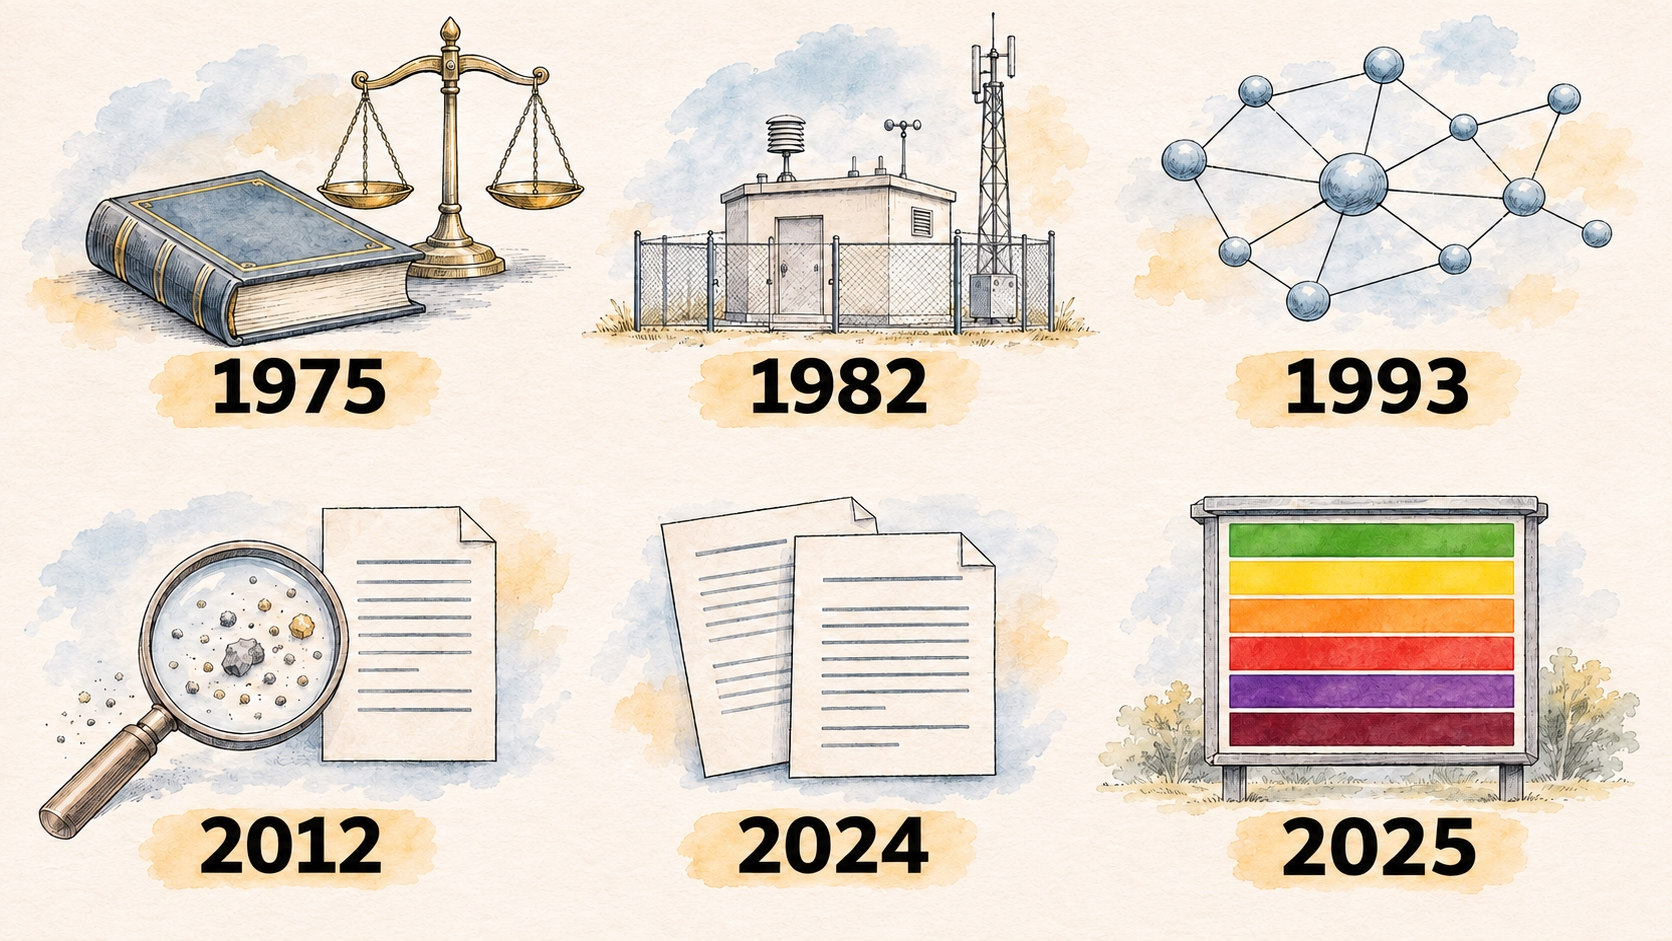
The Air Pollution Control Act was promulgated on 23 May 1975 and has since been amended repeatedly. That date marks the establishment of a legislative framework; it does not mean every source has been managed under today’s arrangements since then. Present-day permitting, emissions, monitoring and disclosure provisions developed at different times. Reading the history requires avoiding the projection of the entire current system back onto its first version.
Legislation can define responsibilities, but understanding environmental change requires sustained observation. Historical reviews by the environmental authorities record the progressive installation of automatic air-pollutant monitoring stations from 1982 and completion of the Taiwan air-quality monitoring network project in September 1993. These two milestones reflect the expansion of automatic monitoring and the coordinated construction of the station network, respectively.
A network allows readings at a location to accumulate into a record that can be compared and questioned. A photograph preserves poor visibility at a particular moment; a monitoring series accompanied by method and quality information supports discussion of changes in a specified pollutant. The visible sky and measured concentrations each have meaning. A clear view alone cannot establish that all pollutants of concern are in the same condition.
Monitoring networks also change. Locations, measured pollutants, instruments and quality management may be adjusted over time. Comparing decades of data therefore starts with checking whether the stations and parameters match, which methods were used, and how gaps or changes were handled. These details are less conspicuous than the numbers, yet they determine what a long-term curve can explain.
Adding PM2.5 to the standards meant more than another column
On 14 May 2012, the Environmental Protection Administration amended the Air Quality Standards to include fine particulate matter, PM2.5. The standards then specified an annual mean of 15 micrograms per cubic metre and a 24-hour value of 35. The agency’s contemporary explanation also discussed preparation of testing methods and measurement capacity. This is a concrete example of how adding a number to a standard also requires consistent ways to obtain and interpret the data.
“Annual mean” and “24-hour value” are not interchangeable labels. One addresses conditions across a year; the other corresponds to a particular sampling period. Declaring compliance or an exceedance by comparing one minute of data from a small sensor directly with an annual standard changes the time scale. The reading may still provide useful information, but the question and comparator must be explained again.
This is why legislation, measurement methods and data quality need to be read together. A standard specifies a pollutant, units, averaging period and assessment method; monitoring also requires information about instrument operation and data review. Keeping only a concentration limit strips away conditions that make the management tool meaningful, leaving an apparently simple line that may be applied to the wrong situation.
Each new monitoring parameter invites a further question: which previously unobserved changes can now be discussed, and can the available data answer the new requirements? Connecting an institutional change to the evidence used in practice makes it possible to understand its contribution and what still needs to be addressed.
The 2024 revision asks what an average can conceal
On 30 September 2024, the Ministry of Environment revised the Air Quality Standards, lowering the PM2.5 annual-mean standard from 15 to 12 micrograms per cubic metre and the daily-mean standard from 35 to 30. Other pollutant standards also changed. When interpreting data across years, remember that the version of the standard may have changed alongside the concentrations.
Another significant change was the move from an overall average across a city or county’s stations toward requiring individual stations to meet the standard when assessing control areas. The current provisions still specify statistical and valid-data requirements. “Every station” does not mean that every instantaneous reading must lie below one number. The shift in focus is nevertheless clear: a better regional average should not automatically make problems at individual locations disappear from view.
A hypothetical example, not a description of any actual municipality, helps explain this. Suppose several neighbourhoods have different concentrations, with one relatively high and others lower. Discussing only the combined average may dilute the experience of residents in the higher-concentration area. Examining stations separately brings location back into the discussion, making it possible to investigate influencing conditions and improvement priorities. This illustrates a statistical perspective, not a compliance judgment on a real place.
After a standard is announced, the work of improvement still has to follow. A revision changes requirements and assessment criteria, but it does not immediately reduce pollutants in the air. Emissions management, engineering and operational improvements must be implemented and their results observed through reliable data. Without that account, announcing a policy can too easily be confused with completing the improvement.
AQI communicates with the public; emissions management assigns separate duties
Alongside the revised standards, the Ministry adjusted Air Quality Index concentration breakpoints from 1 January 2025. AQI translates pollutant concentrations into an accessible index for communicating current air quality and protective advice. Readers can consult official explanations for the dominant pollutant and relevant guidance rather than remembering only a colour. If classification criteria change, comparisons of colour-coded days across years also need to disclose that change.
Three matters can be kept distinct: ambient air-quality standards assess the environment, AQI helps the public interpret information, and source-specific emissions and permitting requirements govern particular activities. They are related but not interchangeable. A Good regional AQI does not demonstrate that every factory meets its operating conditions. A source completing statutory testing does not establish that the entire region has no air-quality problem.
The current Act sets different requirements for designated stationary sources, including installation and operating permits, monitoring and reporting. A business first needs to establish the source category, permit conditions and standards that apply to it, then organise information and operating management accordingly. Treating an environmental sensor outside the premises as a single solution to all statutory requirements overlooks differences in methods, locations and purposes.
Monitoring equipment makes certain changes visible; pollution-control equipment and process management carry out the work of reducing emissions. In management terms, a rising reading needs interpretation, investigation and action on possible causes. Adding an instrument does not itself make emissions fall. This basic distinction helps purchasers identify separate tasks and budgets for obtaining information and improving pollution conditions.
Stations and small sensors can address different scales of question
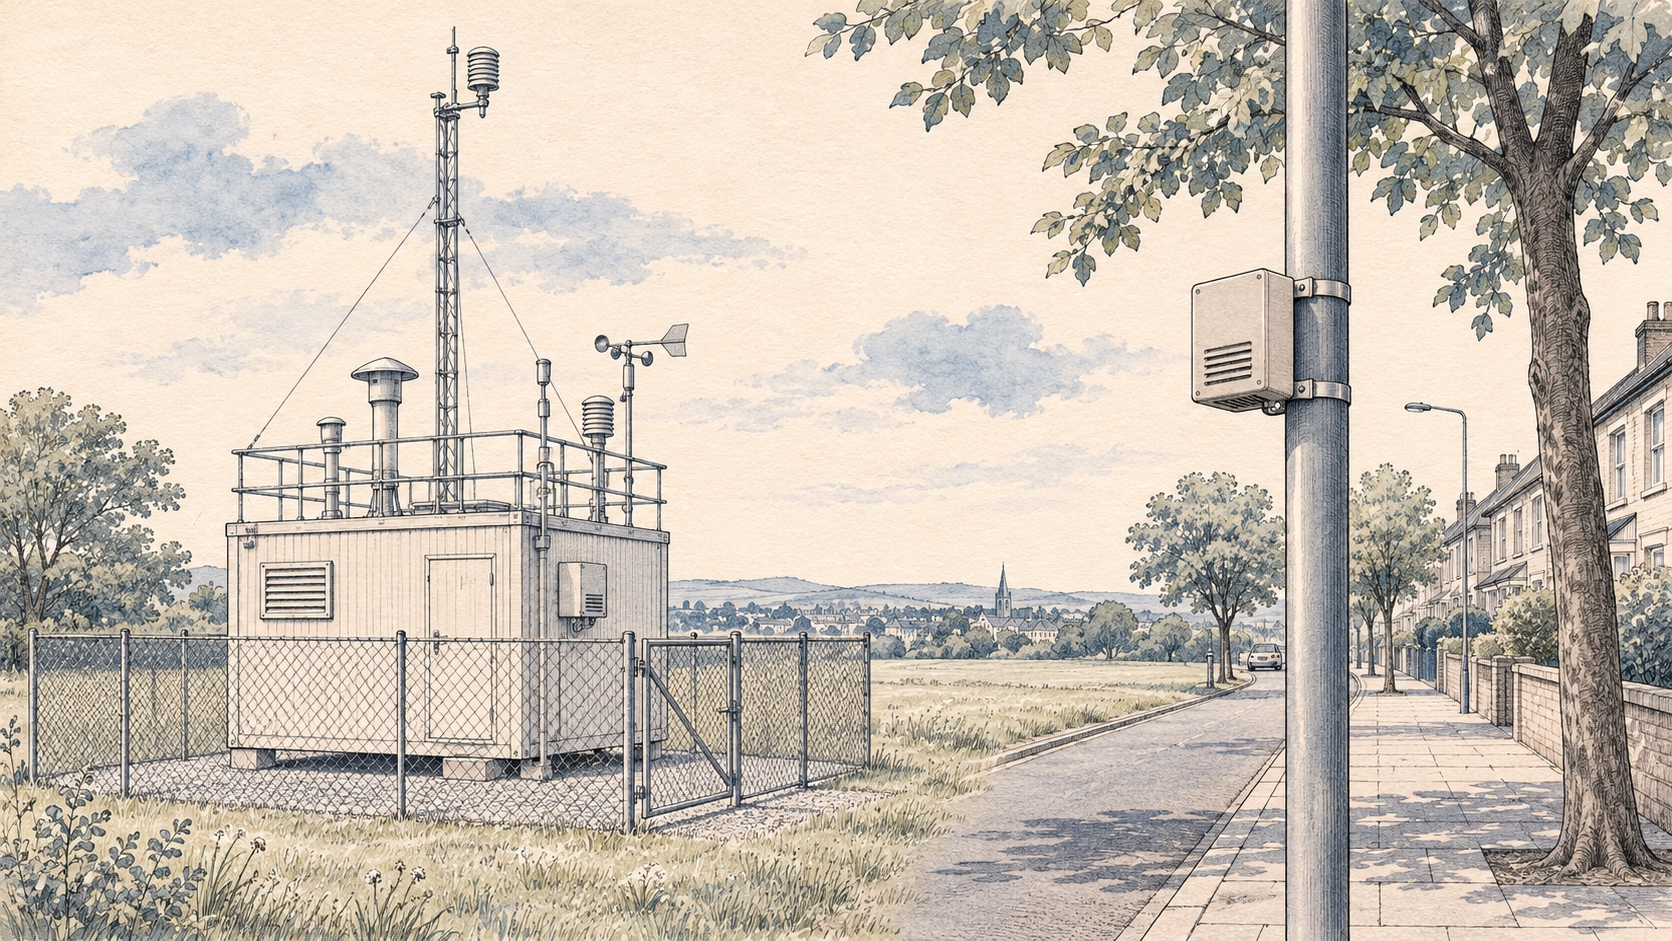
The Ministry’s monitoring-network explanation distinguishes national stations, Smart Urban and Rural sensing points, and privately operated microsensors. National stations focus on broader-area air quality and long-term trends. Dense sensing networks can help identify changes over smaller areas, while private instruments can offer clues about nearby living environments. Displaying all of them on one map is convenient, but users still need to understand how each point’s data was produced.
Size is not the only difference. Measurement principles, sampling conditions, maintenance, calibration and data review may affect results. Official explanations also note differences between optical particle sensing and standard measurement methods, including the influence of moisture. The appropriate uses of small sensors must be considered together with data quality; the number of decimal places on a display does not explain the underlying measurement quality.
Imagine residents noticing that nearby sensor readings repeatedly rise at a particular time. That is a clue worth preserving through records of time, location, equipment condition and nearby activities, alongside neighbouring measurements and weather information. But one curve does not automatically identify a particular emitter or complete a source investigation. Moving from a clue to evidence supporting responsibility still requires investigation and suitable measurement arrangements.
The same applies to site managers. Observing relative changes at one location may call for different equipment and data arrangements from statutory testing. Formal reporting requires confirmation of accepted methods and qualifications. Defining the question before choosing instruments, locations and data-retention arrangements reduces the risk of discovering, after purchase, that the readings cannot be used as intended.
Disclosure can make participation more specific, but interpretation still matters
Public participation need not stop at perceptions of good or bad air. The current Act requires relevant stationary-source permit application information to be disclosed before permits are issued so people can inspect it and comment. The Ministry also operates a disclosure platform covering permits, reported emissions, monitoring and testing information, with participation functions. This is a tangible institutional arrangement that can direct discussion toward identifiable documents and management issues.
Disclosure also needs to make information understandable. Permit conditions, emissions quantities, ambient concentrations and measurement methods have distinct meanings, and files need clear field descriptions and version information. When residents identify a time, place and parameter and authorities or operators respond from specific records, discussion has a shared starting point. A general statement that everything complies does not, by itself, explain what happened.
Traceability also benefits businesses. If equipment maintenance, process changes, operating logs and monitoring information refer to the same period, it becomes easier to reconstruct events when questions arise. If each department retains only its latest summary, while original conditions and reasons for revisions have been lost, the overall account may remain unclear even when everyone believes they dealt with their own part.
A gap, a correction and a maintenance event are all part of a dataset’s history. Alongside a continuous curve, retain annotations that show which intervals can be used and which inferences still lack support. Accessible original records and correction reasons prevent a new colleague from having to reconstruct the background by guesswork. These less conspicuous details make data quality part of the conversation.
From warnings to improvement, ask whether the measures actually happened
Monitoring also supports short-term response. The Ministry’s explanation of severe-deterioration warnings describes arrangements for emissions reduction, load reduction and public protection based on forecasts and monitored conditions, with central, local and source-level responsibilities. This is another practical institutional example: information does more than describe air quality afterwards; it can support actions planned in advance. The action required at a particular premises still follows the relevant notification and procedure.
Assessing these measures takes more than checking whether concentrations fell in one hour after a warning. Weather, regional transport and other emissions also influence conditions, making a simple before-and-after comparison insufficient to separate every cause. A stronger account identifies what was done, where and when, and which data and methods were used to examine the result. That moves policy review from broad claims toward questions that can be checked.
Long-term improvement requires longer observation. Annual changes, individual seasons and particular stations can each reveal different patterns; they need not be compressed into a single verdict of success or failure. Improvement in one pollutant can coexist with difficulties elsewhere or in another pollutant. Preserving these distinctions helps identify where the next round of work belongs.
From the 1975 law and automatic monitoring in the 1980s to the 1993 network, PM2.5 standards and later revisions, the range of management tools has expanded. Their practical contribution still depends on responsibilities being fulfilled, data being reliable and improvements actually taking place. The history of the system also resides in this continuing work.
When reading an air-quality number, first identify its location, period and pollutant, together with its method and benchmark, before asking what action it can support. A site planning a monitoring programme can begin in the same way: define the management question, then arrange the data and equipment. With an appropriate purpose, that institutional history becomes useful to decisions made today.
References
- Ministry of Environment: Legislative history of the Air Pollution Control Act
- Ministry of Environment: Current Air Pollution Control Act
- Environmental authority: 2004 air-pollution-control review, monitoring-network history
- Environmental authority: PM2.5 policy and measurement capacity (2012)
- Ministry of Environment: Explanation of the 2024 Air Quality Standards revision
- Ministry of Environment: Current Air Quality Standards
- Ministry of Environment: Air Quality Index explanation
- Ministry of Environment: National monitoring stations and different sensor networks
- Ministry of Environment: Stationary-source information disclosure platform
- Ministry of Environment: Severe air-quality deterioration warnings
MTI巨晶彙審